Vacancy Beginning to Stabilize in the Industrial Market
In its August 2024 Labour Force Survey, Statistics Canada reported continued minimal change in employment levels. The unemployment rate however climbed by 20 basis points (bps) from July to 6.6% as growth in the working age population who are actively searching for work continued to outpace the supply of jobs. Employment in industries that would generally be occupying industrial space has remained fairly stable throughout 2024, with year-over-year employment growth of 1.6%.
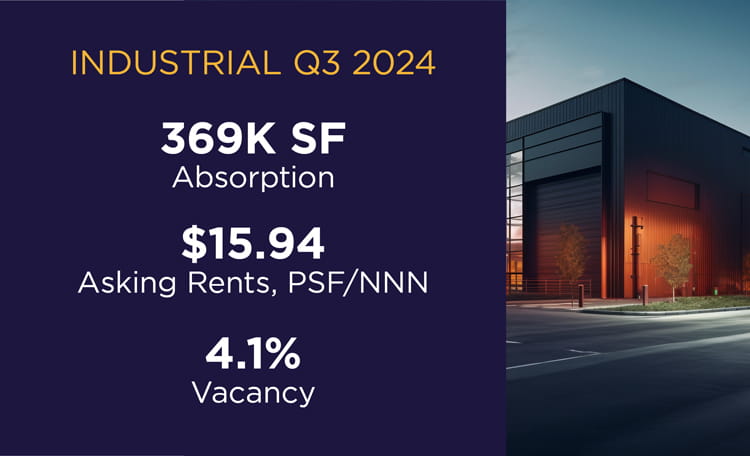
While the overall industrial vacancy rate in the third quarter of 2024 climbed quarter-over-quarter (QOQ) to 4.1%, this 30-basis point (bps) increase was the smallest QOQ increase since the second quarter of 2023. A similar trend was witnessed in all of the major Canadian markets. While these markets did post higher vacancy this quarter compared to last, the QOQ increase was generally not as steep as what has been occurring since mid-2023.
This slowdown in the vacancy increase was also reflected in the amount of vacant space on the market - which now sits at close to 77.0 million square feet (msf). This is an increase of approximately 6.0 msf from the second quarter of 2023, and while this is an indication that occupiers continue to shed space and vacant space in new supply is arriving to the market, this is a notable improvement from what the market had been seeing at the end of 2023 through the first half of 2024 where vacant square footage had been climbing by at minimum 10.0 msf a quarter. Sublet vacancy did rise this quarter to reach close to 10.9 msf and as a percentage of total vacancy is now at 14.1%. Like overall vacant space; however, sublet vacancy only increased a minimal amount from last quarter by approximately 500k square feet (sf). This marks a departure from what had been occurring for the past four quarters where sublet vacancy had been rising by approximately 2.0 - 2.5 msf a quarter.

After reaching close to a historic level of negative absorption last quarter, absorption rebounded back into positive territory to reach 369k sf in the third quarter of 2024. While this marks a substantial QOQ improvement, it does represent the lowest level of positive absorption the overall market has generated since the fourth quarter of 2014. Absorption levels in Calgary, and particularly Toronto, strengthened considerably from last quarter, while Vancouver dipped into the negative. A driving factor behind that was likely the minimal amount of new supply delivered in Vancouver this quarter; with a total of just 143k sf in three properties, the preleasing that had been completed was not enough to counteract the new vacancy that arrived on the market in existing inventory. Market conditions in Montreal remained weak, with negative absorption of approximately 1.8 msf this quarter, and acted as a drag on the overall Canadian total.
Although it has not fully translated into sustained positive absorption, leasing activity has remained consistent to date in 2024, with leasing activity reaching 11.9 msf this quarter which is the highest total so far this year. While preleasing activity has slowed in comparison to what had been witnessed in 2021 and 2022, particularly in those larger "big-box" spaces of over 125k sf, leasing activity from the number of transactions completed perspective is forecasted to be higher than what was recorded in 2023.
New supply arrivals reached 6.0 msf this quarter. While Toronto and the Waterloo Region had over 1.0 msf deliver at 1.8 msf and 1.4 msf, respectively, Calgary outpaced both markets to reach just over 2.0 msf. Looking to the remainder of 2024 a significant amount of close to 17.8 msf is scheduled to be completed, with over 9.8 msf of that located within Toronto. If all this inventory is in fact delivered in the fourth quarter, it has the potential to bump up the overall vacancy rate to 4.6% as approximately 70% of that 17.8 msf total remains available.
After peaking in the third quarter of 2023 at $17.12 per square foot (psf) the overall asking average net asking rental rate continued to trend downwards this quarter to reach $15.94 psf. The vast majority of the Canadian markets posted either flat or declining rates compared to last quarter. Softening in the rates are being witnessed more so in older, less-attractive inventory as opposed to the newer product. However, there are early indicators that the asking rates for the larger, big-box product that has been recently delivered may experience some downward pressure as demand for this size of space has softened considerably.


