Learn more by clicking our most recent Pune MarketBeat reports on the various sectors below.
Pune MarketBeat Reports
15/01/2025
Cushman & Wakefield MarketBeat reports analyze quarterly economic and commercial real estate activity including supply, demand and pricing trends at the market and submarket levels.
CURRENT MARKETBEATS

Pune Office Report
Pune office market saw gross leasing volume (GLV) of 1.7 MSF in Q4-24. Fresh leasing stood at ~1.3 MSF. SBD East accounted for 61%, followed by SBD West with 20% share. BFSI led with a 37% share, followed by the IT-BPM (26% share). Net absorption stood at 5.0 MSF, an ~11% increase q-o-q. New supply in Q4 was highest amongst all quarters of 2024, reaching a total of 4.2 MSF for the year. Headline rents remained unchanged.

Pune Retail Report
Pune recorded mall leasing of 47,744 in Q4-24 with superior grade malls contributing 80% share. Fashion segment led with 53% share, followed by F&B (17%), and accessories and lifestyle (11%). Mall vacancy rose to 7% q-o-q. Main street leasing stood at 44,575 SF, led by the fashion segment (27%) and followed by the F&B (18%) and accessories & lifestyle (15%) segments. Overall mall rentals remained stable while main street rentals appreciated 3-5% compared to Q3-24.

Pune Residential Report
Pune’s residential market saw 10,237 unit launches in Q4-24. The mid-segment led with 61% share, followed by high-end units at 26%. The luxury segment witnessed a significant increase, with unit launches being 12X higher than those recorded in 2019. NH-4 Bypass dominated by capturing a 61% share, 87% of which were in Hinjewadi. This was followed by the east submarket (28%). In 2024, residential prices rose 12% y-o-y, driven by increased high-end launches while rentals remained stable.

Pune Industrial Report
Pune saw 1.78 MSF of warehouse lease transactions in H1 2024, a 21% rise from H2 2023. Automobile sector dominated with ~40% share, recording highest warehouse leasing share in the city. Chakan submarket commanded a 54% share. Pune recorded 4.2 MSF of industrial lease transactions, a 34% rise y-o-y. Engineering and manufacturing captured 56% share, followed by automobile sector (14.6% share). Chakan led Industrial leasing with 71.1% share. City-wide rentals saw 6-8% y-o-y increase.
RELATED INSIGHTS

Article
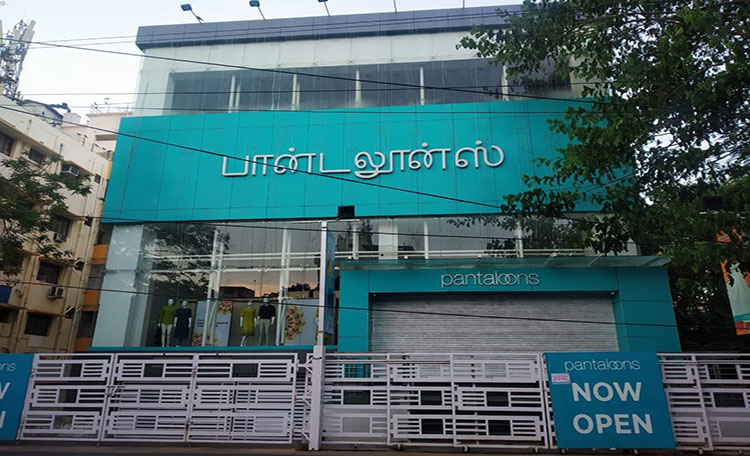
Aditya Birla Fashion and Retail Limited Chennai
Adyar is a very prime & sought-after high street in Chennai and therefore a short-supply market. Aditya Birla Fashion and Retail Limited (ABFRL) was looking out for a property to set up their store in the area.
18/06/2021

Podcast
Podcast: Logistics & Industrial in India
With international business looking seriously at India to take advantage of the world's second largest population - India is a complex and fascinating part of the world, for both investors and occupiers alike.
Rob Hall • 16/10/2020

