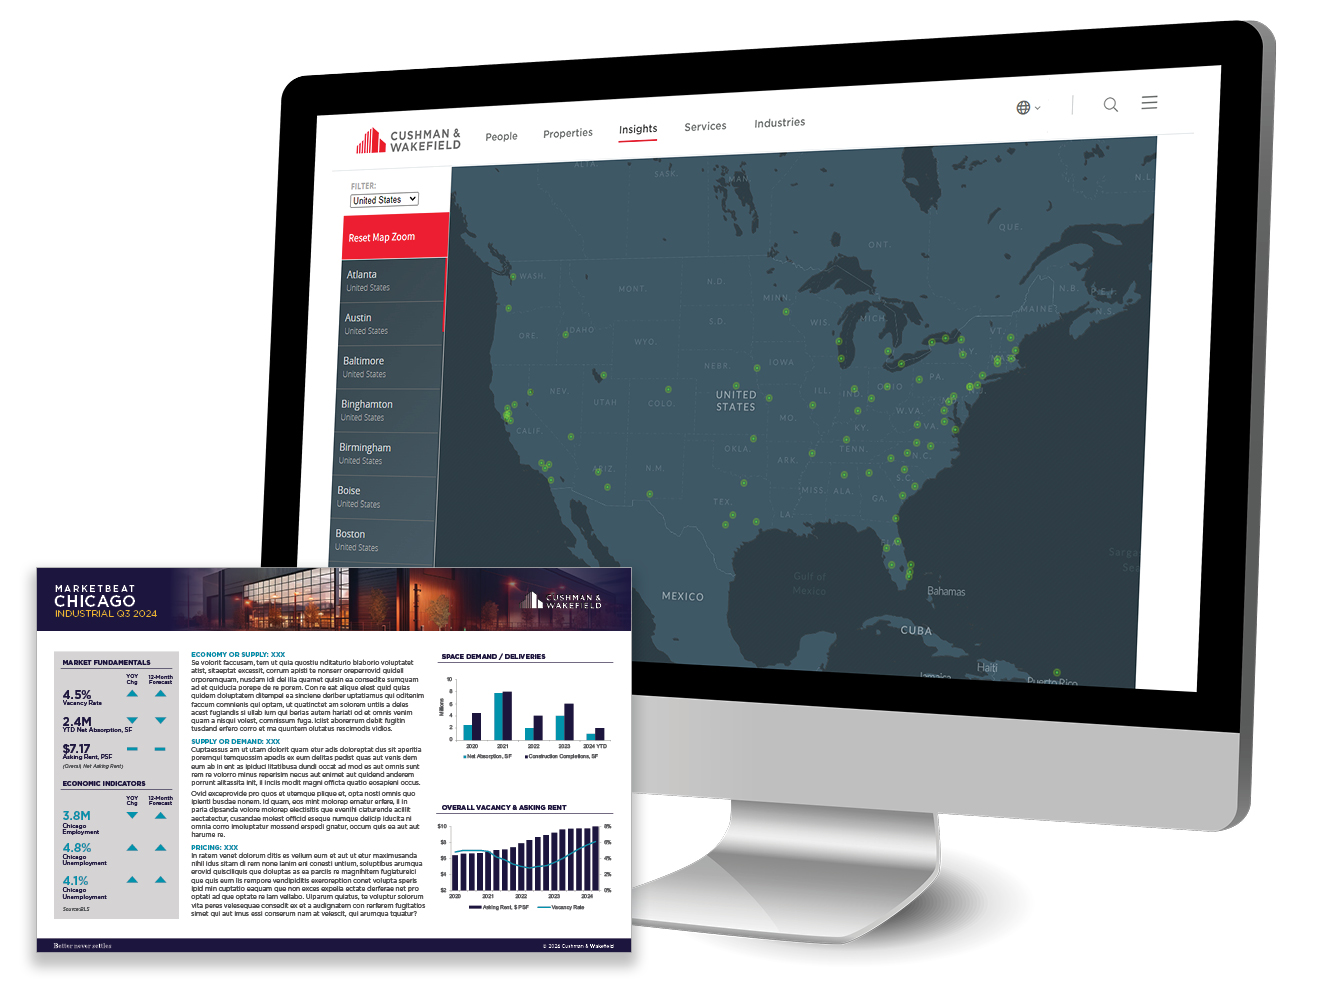
For the data behind the commentary, download the full Q4 2024 U.S. Industrial Report.
Quarterly Net Absorption Climbs but Remains Below Recent Highs
Despite headwinds throughout the year—including high interest rates, inflation, labor disputes and election uncertainties—the U.S. industrial market remained resilient, with modest growth persisting. Net absorption totaled 135 msf for 2024, with stronger performance in the second half of the year. Of the 84 markets tracked by Cushman & Wakefield Research, 54 reported positive occupancy growth in the fourth quarter, including 11 markets with more than 1 msf of absorption. However, five markets yielded net losses exceeding 1 msf, including Columbus (-3.6 msf), Los Angeles (-2.1 msf), Central Valley (-2.0 msf), Northern New Jersey (-1.2 msf) and Orange County (-1.1 msf) as occupiers consolidated operations to cut costs and improve efficiency. Compared to 2023, most markets posted a deceleration in absorption totals in 2024, though some bucked the trend. Phoenix, Savannah, Salt Lake City and St. Louis recorded year-over-year (YOY) growth in net demand of 35% or more.
Vacancy Rises at Slowest Pace in Two Years
Driven by vacant, speculative supply, overall vacancy rose by 150 bps in 2024, to 6.7%. The pace of increase slowed significantly in the fourth quarter, suggesting vacancy may approach peak levels in the first half of 2025 amid softer completion totals and a moderation in space dispositions. Overall vacancy remained 30 bps below pre-pandemic levels, with half of the markets tracked by Cushman & Wakefield Research recording rates below 6.0% at year-end.
However, some markets with high speculative development or modest demand totals, such as Austin, Phoenix, Greenville and Las Vegas—posted double-digit vacancy rates. Vacancy rates continued to be nuanced by size segment with smaller industrial product (under 100,000 sf) remaining tight at 3.9%, while big-box product (300,000+ sf) recorded a 10.7% vacancy rate, driven by 51% of YTD speculative deliveries in this segment. The rate at which vacant sublease space entered the market slowed in the fourth quarter as availabilities increased by just 5.0 msf. Only a few markets registered notable increases in sublet space in the fourth quarter.
U.S. Average Rent Up 0.9% QOQ; 30% of Markets Report Annual Declines
The national average asking rent for industrial space rose by 0.9% QOQ to $10.13 per square foot (psf). Annual rent growth ticked marginally higher in the fourth quarter to 4.5%, fueled by the South region’s 6.0% YOY increase. Some rent increases were tied to deliveries of vacant, speculative industrial product, priced at a premium over market averages. However, 30% of U.S. markets saw annual declines, with notable drops along the West Coast. Amid rising vacancy rates and the deceleration in net absorption, Los Angeles, the Inland Empire and Puget Sound – Eastside each recorded YOY rent decreases exceeding 10%. Despite these declines, long-term rent growth remained strong, with 43% of markets reporting five-year rental rate growth of 50% or higher, including six markets that have seen asking rents surge by 100% or more since the end of 2019. As a result, occupiers that are renewing their lease or looking to relocate face substantially higher rates, even as some markets have documented rental rate declines over the last year.
New Supply Decelerates to Lowest Level Since Mid-2021
Supply pressures eased as new completions fell for the second consecutive quarter to 85.3 msf, with 59% concentrated in the South region. This marks the weakest quarter for new supply since mid-2021. New supply for the year was propelled by facilities in the 100,000-300,000-sf range (35.3%), as this size segment has historically driven demand. The construction pipeline continues to dissipate amid modest groundbreakings and healthy delivery totals, with 290.5 msf underway—a 36% drop from one year ago. Of this total, 85% is warehouse and logistics space, while build-to-suit (BTS) projects account for one-third of the square footage. Within the current speculative pipeline, facilities from 100,000-500,00 sf account for nearly 60% of the square footage underway at year-end, while warehouses over 1 msf represent just 7.0%. Some markets posted YOY pipeline growth, including Reno (+374%), Orange County (+64%) and Louisville (+38%).
For the data behind the commentary, download the full Q4 2024 U.S. Industrial Report.


